No products in the cart.


Legacy finance is bear market As a prolonged period of price decline in which the price of an asset falls by more than 20% from its recent high.
There is no standardized definition of a crypto bear market. However, given that digital assets are far more volatile, it has been argued that the percentage drop that determines a cryptocurrency bear market is -40%, possibly -60%.
Nevertheless, with the market down about 74% from its peak in 10 months, crypto bears are definitely coming to Bitcoin.
On June 18, BTC hit a local bottom of $17,700, marking the first time in history that it closed below the previous cycle peak. . However, analysis of some on-chain indicators suggests otherwise.
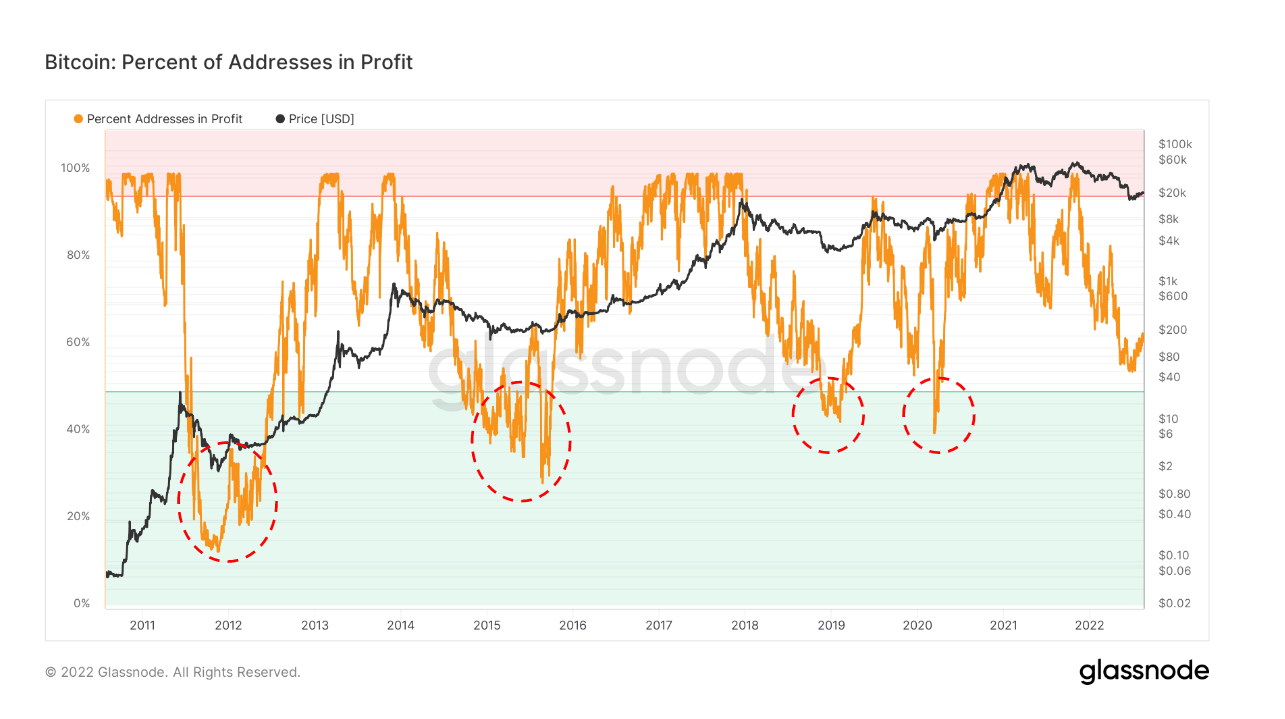
The percentage of Bitcoin addresses that are profitable refers to the percentage of unique addresses whose average purchase price is lower than the current price.
In this case, the Purchase Price is defined as the price at which the Tokens are transferred to the address.
Less than 50% of Bitcoin addresses were lost at the bottom of each previous cycle. The chart below shows that the current reading is around 58%, suggesting that the price of BTC needs to drop further.
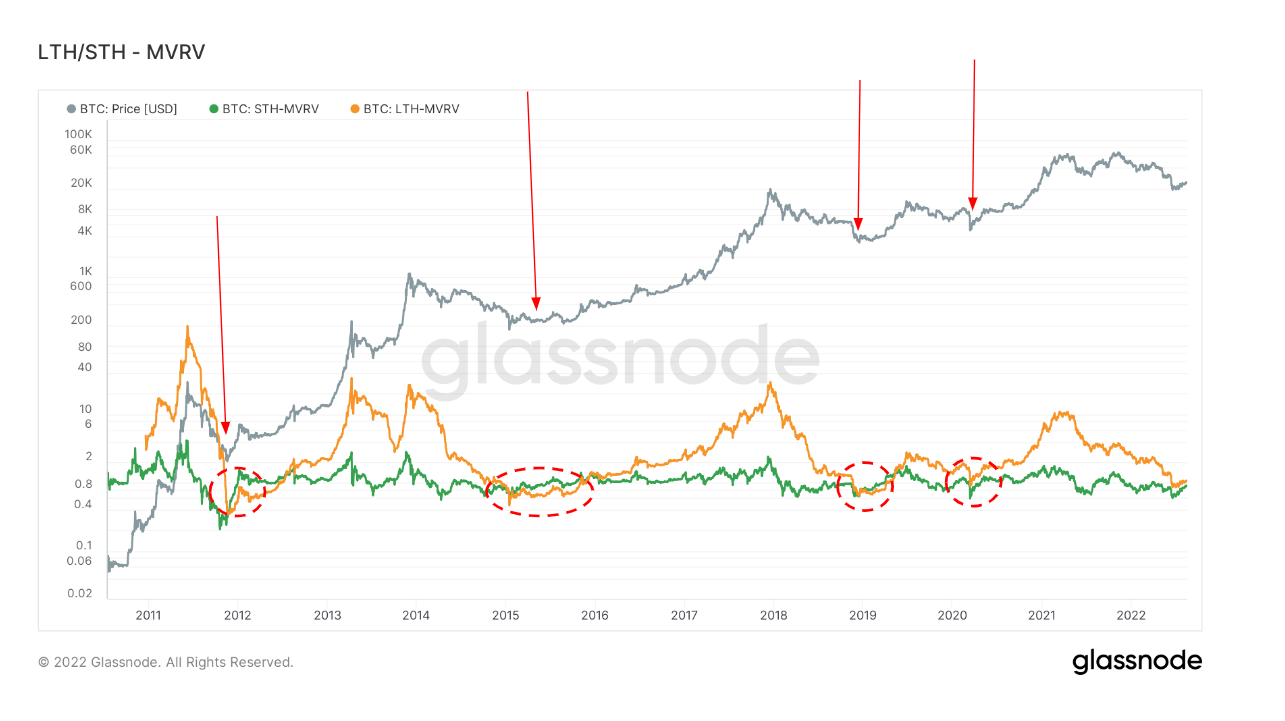
Market Value to Realized Value (MVRV) refers to the ratio between market cap (or market value) and realized cap (or stored value). By collating this information, MVRV indicates whether the price of Bitcoin is above or below the “fair price”.
At the same time, by comparing long-term and short-term MVRV, we can gauge the surrender of long-term holders.
Long-Term Holder MVRV (LTH-MVRV) considers only unused transaction outputs with a validity period of at least 155 days. It is an index that evaluates the behavior of long-term investors.
The troughs of the last four cycles were characterized by convergence of the STH-MVRV and LTH-MVRV lines. No such crossover has occurred yet, suggesting that long-term holders must surrender in relation to short-term holders.
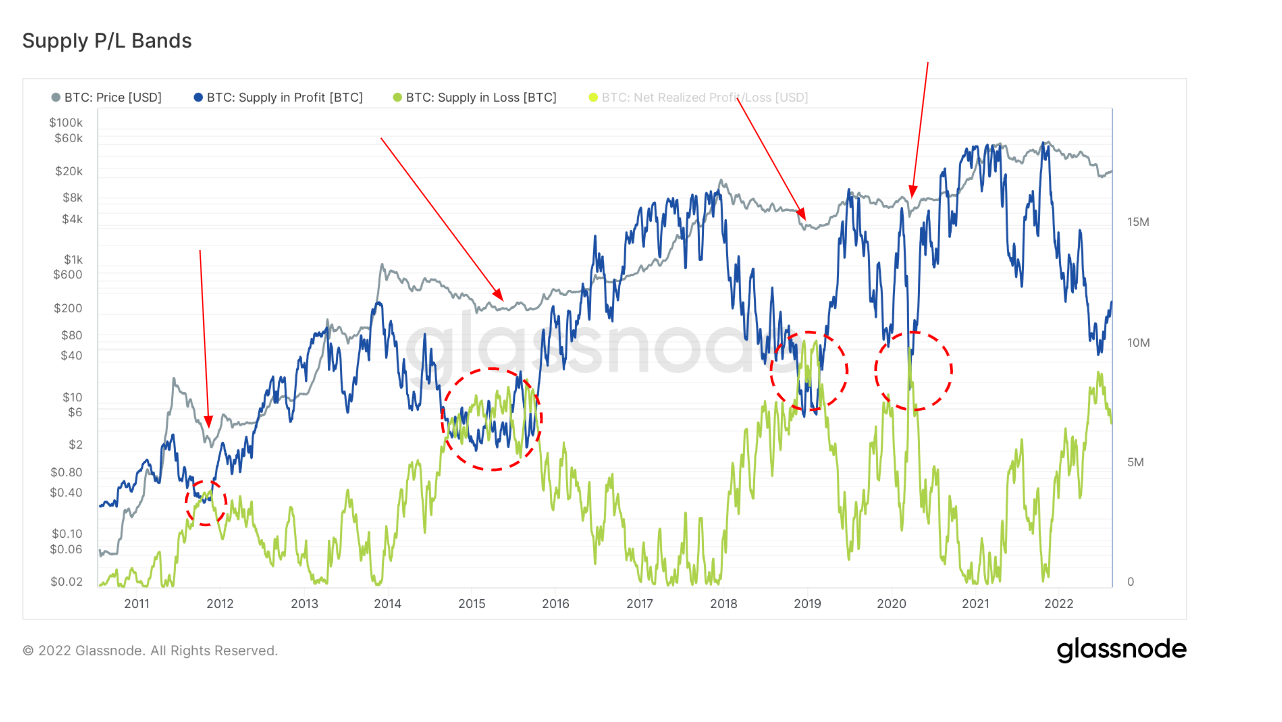
Supply in Profit and Loss (SPL) looks at the circulating supply at profit or loss. In other words, it looks at how many tokens were priced lower or higher than the current price when the token last moved.
As in the previous two examples, the bottom of the previous cycle was when the profit and loss lines converged. Currently, the profit line has not yet converged to the loss line.