


No products in the cart.
The long-awaited Merge will connect Ethereums existing execution layer to the Proof of Stake consensus layer. As this is a milestone event in the project’s evolution, general market sentiment is that investors are buying in for a sustained pump.
But analysis of the options market suggests that a merger could be a “buy the rumor, sell the news” event.
volatility smile
The Volatility Smile chart is the result of plotting strike price and implied volatility for options with the same underlying and expiry date.
Implied volatility increases when an option’s underlying is more out of the money (OTM) or in the money (ITM) than at the money (ATM).
Making an option more OTM usually results in higher implied volatility. Therefore, the volatility smile chart usually shows a “smile” shape. The steepness and shape of this smile can be used to assess the relative cost of an option and determine the type of tail risk the market is pricing in.
Accompanying legends refer to past overlays, showing smile shapes 1 day, 2 days, 1 week, and 2 weeks ago, respectively. For example, if ATM implied volatility values for extreme strikes are lower today compared to historical overlays, it could indicate that the market is pricing in less tail risk. In such cases, the likelihood of extreme moves compared to moderate moves is reduced in the market’s view.


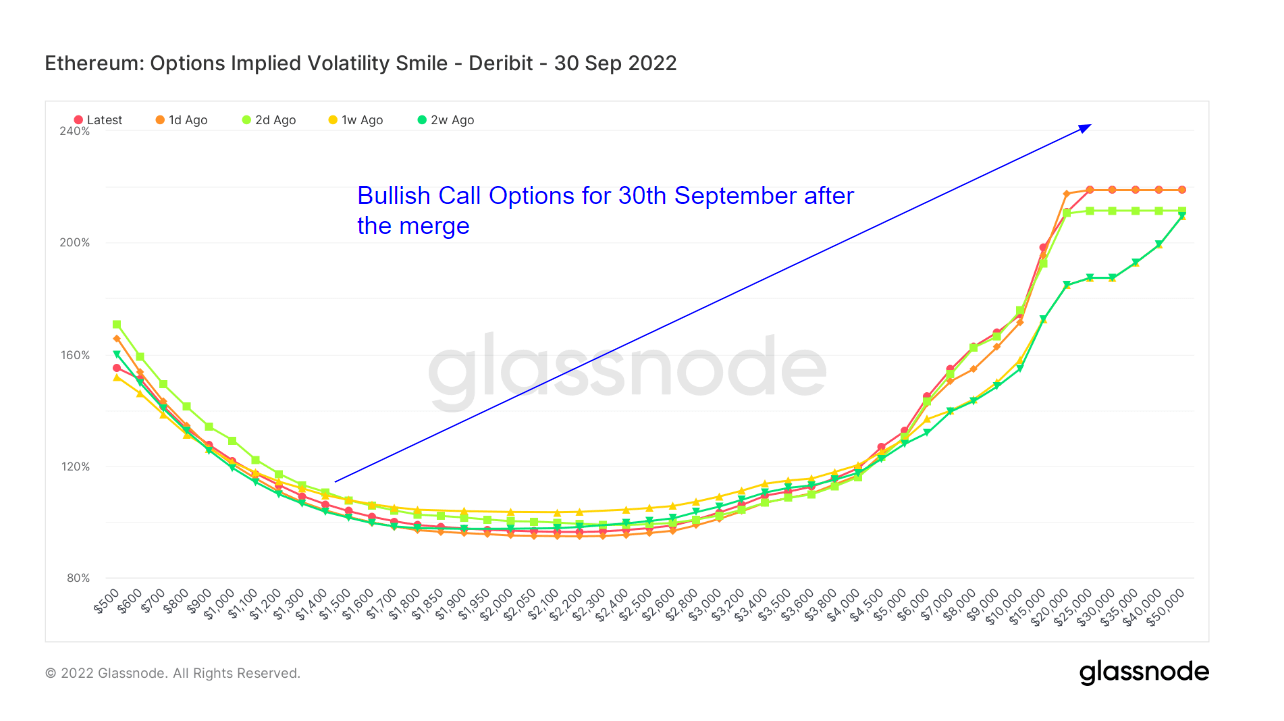
The merger is scheduled for Sept. 15, and huge demand for call options expiring at the end of September has contributed to the price bullishness. Implied volatility rises by more than 200% when the price crosses his $10,000 to $50,000 mark. This means investors are willing to pay a premium.
Ethereum Options Demand Post-Merger Tailing
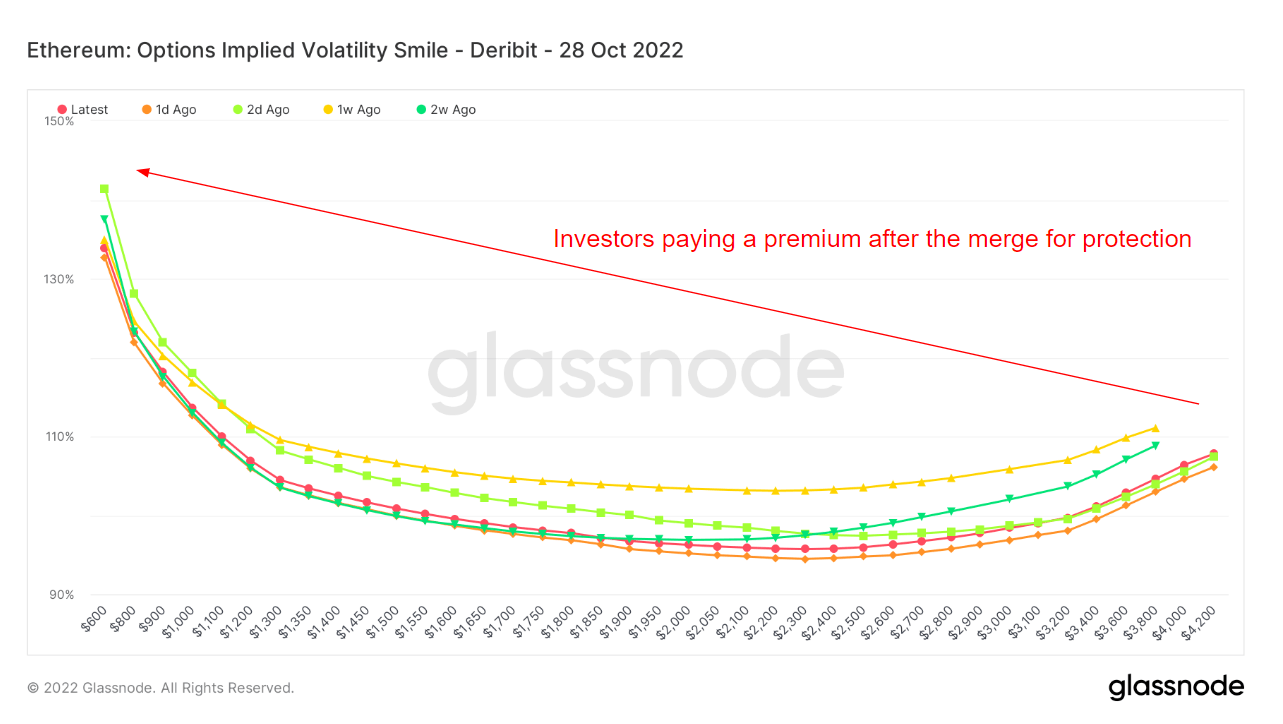
Volatility for options expiring in October shows a dramatic shift in the volatility smile.
The chart below shows a sharp drop that indicates a flatter structure. This change suggests that demand for Ethereum options will drop after the merge goes live.
Nonetheless, the left tail of implied volatility remains high, suggesting that traders are willing to pay a premium on put options post-merger.
Together, the two charts show options traders buying rumors and selling news.
